Manual of the Aarenet VoIP Switch Support Tools
| Note | The features and/or parameters listed in this article may not be available from your telephone service provider. |
|
|
|
|
|
Introduction
The VoIP Switch Administrators, Operators, Supporters find here information about the Aarenet VoIP Switch "On Board" tools for analyzing and supporting general VoIP Switch issues and customer problems:
- The ConfigCenter "Support Log" displays the VoIP Switch internal activities
- The ConfigCenter "Traces" displays the signaling between the VoIP Switch an external devices
- The ConfigCenter "Call Data" lists the CDR of all incoming or outgoing connections or connection attempts. The "Call Data" provide shortcuts to SIP, SDP trace and RTP statistic information of a single call.
- The ConfigCenter "Address Registration" displays if a SIP device or MGCP MTA has registered a telephone number
- The ConfigCenter "System Components" displays the state and activity of the VoIP Switch components
- The ConfigCenter "Channels" displays the state of connections
- The ConfigCenter "System Utilization" displays a statistical overview of the VoIP Switch resource utilization
Contents
VoIP Switch ConfigCenter Support Tools
The ConfigCenter Support Log
The "Support Log" provides the supporter with information from the internal processes of the ServiceCenter:
- Registration
- Connection setup, release and exceptions
- Call Routing
- Used Ruleset
- Emergency calls
- etc
The "Support Log" provides filters for:
- Time based selection: From – Until, From – Duration
- Text filter
- Registration events
- Call events
- etc.
The "Support Log" has a limited history. The history may last from a few hours up to some days. The length of the history may be different from VoIP switch to VoIP switch and depends on the length of log files and amount of logging events.
| Note |
The "Support Log" is tenant sensitive. This means a supporter of tenant A is not able to see events of tenant B! |
ConfigCenter:
-
 Menu "Support"
- Menu "Support Log"
-
Get a "Support Log"
Dialog: "Support Log":

When the dialog "Support Log" opens it contains by default in "From" the actual date/time (-5min) and in "Duration" a duration of 5min:
- Click the Button [ Download ]
- Via HTTP an ASCII formatted file with the last 5 minutes will be downloaded
Retrieving a "Support Log" in the past:
- Insert the in "From" the desired start date/time
- Insert in "Duration" the needed length
- Press on the PC keyboard the 'Enter' key : The "Until" date/time will be computed
- Click the Button [ Download ]
or
- Insert the in "From" the desired start date/time
- Insert the in "Until" the desired stop date/time
- Press on the PC keyboard the 'Enter' key: The "Duration" will be computed
- Click the Button [ Download ]
| Best Practice |
Get the events of a connection in the past:
|
Interpretation of a "Support Log"
The interpretation of a "Support Log" is quite easy and straight forward. With a little experience one will be soon familiar with the interpretation.
Interpretation and example of a call setup and release:

ConfigCenter Trace
The "Trace" provides the supporter with information from the message traffic between the VoIP switch and external VoIP devices, such as PSTN gateway, SIP CPE, SIP or MGCP telephones.
The "Trace" contains:
- Session Initiation Protocol SIP registration and connection signaling messages
- Media Gateway Control Protocol MGCP audit and endpoint control messages
- Session Description Protocol SDP streaming media initialization parameters
The "Trace" provides filters for:
- Time based selection: From – Until, From – Duration
- Text filter
The "Trace" has a limited history. The history may last from a few hours up to some days. The length of the history may be different from VoIP switch to VoIP switch and depends on the length of log files and amount of logging events.
The interpretation of a "Trace" (PCAP formatted file) has to be done in an external application like Wireshark network protocol analyzer. Wireshark offers deep and rich VoIP analysis .
| Note |
The "Trace" is not tenant sensitive. This means a supporter of tenant A is able to see signaling messages of tenant B! Due to this open display of information it may be possible that the "Trace" is not available for the supporters and operators on a multi tenant VoIP Switch. |
ConfigCenter:
- Menu "Support"
- Menu "Trace"
-
Get a "Trace"
Dialog: "Trace":

When the dialog "Trace" opens it contains by default in "From" the actual date/time (-5min) and in "Duration" a duration of 5min:
- Click the Button [ Download ]
- Via HTTP an PCAP formatted file with the last 5 minutes will be downloaded
Retrieving a "Trace" in the past:
- Insert the in "From" the desired start date/time
- Insert in "Duration" the needed length
- Press on the PC keyboard the 'Enter' key: The "Until" date/time will be computed
- Click the Button [ Download ]
or
- Insert the in "From" the desired start date/time
- Insert the in "Until" the desired stop date/time
- Press on the PC keyboard the 'Enter' key: The "Duration" will be computed
- Click the Button [ Download ]
| Best Practice |
Get the events of a connection in the past:
|
Interpretation of a "Trace"
The interpretation of a "Trace" needs experience!
For more information:
- See also article "Brief Tutorial of the SIP Signaling and SDP Media Protocols"
- Get a Wireshark training
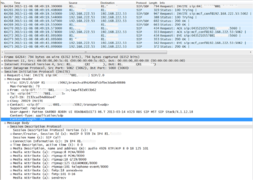
Example of a Wireshark call capture, SIP setup and release:

Example of a Wireshark call list:
Navigate in Wireshark:
- Menu "Statistics"
- Menu "VoIP Calls"
-
Wireshark dialog where all calls are listed of the actual trace:

Example of a Wireshark call flow:
Navigate in Wireshark:
- Menu "Statistics"
- Menu "VoIP Calls"
-
- Select the call of interest
-
- Click Button [ Graph ]
-
Wireshark dialog where the message flow is shown of the selected call:

The ConfigCenter Call Data
The "Call Data" lists the CDR of all incoming or outgoing connections or connection attempts. Extended filters enable the supporter to search for specific calls. The filters can be combined with logical AND.
Filter CDRs according:
- Call start and end date/time
- Call duration
- Call charges
- Telephone number of caller and/or callee.
- Tenants & account
- Price list attributes "Destination Type" & "Destination"
The "Call Data" has a limited history. The length of the history may be different from VoIP switch to VoIP switch and depends on the CDR storage length in the date base.
Selected CDR details allow direct access to the information of:
- SIP Trace:
- The SIP message contents of this specific connection or call attempt is shown. For the interpretation of the trace consult the article "Brief Tutorial of the SIP Signaling and SDP Media Protocols", chapter "Knowhow SIP Signaling" .
-
- RTP/RTCP Media:
- The RTP/RTCP information and statistics of this specific connection or call attempt is shown. For the interpretation of the media information consult the article "Brief Tutorial of the SIP Signaling and SDP Media Protocols", chapter "Knowhow Media Stream" .
| Note |
|
| Warning |
Depending an the settings of a VoIP system it may be possible to change values in CDR. Changing a CDR's contents may be a legal violation in the country of operation of the VoIP Switch! |
ConfigCenter:
- Menu "Rating"
- Menu "Call Data"
-
Get the "Call Data"
Dialog: "Call Data":

By clicking on the line of a CDR a dialog pops up, which provides a) more details of the connection and b) one click access to the call's SIP trace and media RTP/RTCP information and statistics:

For the interpretation of the trace consult the article:
"Brief Tutorial of the SIP Signaling and SDP Media Protocols", chapter "Knowhow SIP Signaling"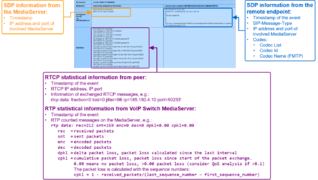
For the interpretation of the media information consult the article:
"Brief Tutorial of the SIP Signaling and SDP Media Protocols", chapter "Knowhow Media Stream"


The ConfigCenter Address Registration
The ConfigCenter "Address Registration" displays if a SIP device or MGCP MTA has registered the telephone number. The supporter finds the following information of the registering devices:
- Type of registration, SIP, notifications, presence, etc
- IP address
- SIP user agent
- Registration time left.
Registrations can be de-registrated on the VoIP Switch by force.
Hint:
The device cannot be informed that it was de-registerd on the VoIP Switch. That means you have to wait until it re-registers automatically or force the device manually to re-register.
ConfigCenter:
- Menu "Addresses"
or
- Menu "Accounts"
- Click on the line of the desired account
-
- Click on the right arrow at "Addresses"
-
For details:
- Click on the line of the desired address
-
- Click on the right arrow at "Registration"
-
Interpretation of "Registrations" Information
Display of "Addresses" and registration overview:

By clicking on the line of an address and then the right arrow at "Registration" a dialog pops up, which provides informations of all registrations of the address:

The ConfigCenter Components
The "Components" displays the state and activity of the VoIP Switch components. The components are the entities of the VoIP Switch that provide all functionality and features. The display is automatically updated every few seconds and shows the actual state and load of every component.
| Note |
On most VoIP Switches the "Components" display is not available for the supporters and operators. |
ConfigCenter:
- Menu "System"
- Menu "Components"
-
Interpretation of "Components" Information
Display of "Components":

By clicking on the line of a component a dialog pops up, which provides more informations or enables to send messages or handle the work load of the component:

The ConfigCenter Channels
The ConfigCenter "Channels" is a live display of the current active connections and connection build-up. The administrator can filter an search the connections. If needed a connection can be forced to be released.
| Note |
On most VoIP Switches the "Channels" display is not available for the supporters and operators. |
ConfigCenter:
- Menu "Channels"
Interpretation of "Channels" Information
Display of "Channels":

The ConfigCenter System Utilization
The "System Utilization" gives a statistical overview of the VoIP Switch resource utilization:
- Number of accounts
- Number of addresses (telephone numbers)
- Number of registrations
- etc
| Note |
On most VoIP Switches the "System Utilization" display is not available for the supporters and operators. |
ConfigCenter:
- Menu "System"
- Menu "Utilization"
-
Interpretation of the "System Utilization" Information
The "System Utilization" provides the numbers of used resources:

© Aarenet Inc 2018
Version: 3.0
Author: Aarenet
Date: May 2017