Difference between revisions of "Support tools"
| Line 10: | Line 10: | ||
The VoIP Switch Administrators, Operators, Supporters find here information about the Aarenet VoIP Switch "On Board" tools for analyzing and supporting general VoIP Switch issues and customer problems: | The VoIP Switch Administrators, Operators, Supporters find here information about the Aarenet VoIP Switch "On Board" tools for analyzing and supporting general VoIP Switch issues and customer problems: | ||
| − | :* The ConfigCenter | + | :* The ConfigCenter "Support Log" displays the VoIP Switch internal activities |
| − | :* The ConfigCenter | + | :* The ConfigCenter "Traces" displays the signaling between the VoIP Switch an external devices |
| − | :* The ConfigCenter | + | :* The ConfigCenter "Call Data" lists the CDR of all incoming or outgoing connections or connection attempts. The "Call Data" provide shortcuts to SIP, SDP trace and RTP statistic information of a single call. |
| − | :* The ConfigCenter | + | :* The ConfigCenter "Address Registration" displays if a SIP device or MGCP MTA has registered a telephone number |
| − | :* The ConfigCenter | + | :* The ConfigCenter "System Components" displays the state and activity of the VoIP Switch components |
| − | :* The ConfigCenter | + | :* The ConfigCenter "Channels" displays the state of connections |
| − | :* The ConfigCenter | + | :* The ConfigCenter "System Utilization" displays a statistical overview of the VoIP Switch resource utilization |
<!-- Transclusion : Intro End --------------------------------------------------------------------><section end=intro /> | <!-- Transclusion : Intro End --------------------------------------------------------------------><section end=intro /> | ||
| Line 29: | Line 29: | ||
{{ToTop | SupportToolConfigCenterSupportLog }} <!--------------------------------------------------> | {{ToTop | SupportToolConfigCenterSupportLog }} <!--------------------------------------------------> | ||
| − | == The ConfigCenter '''Support Log''' | + | == The ConfigCenter '''Support Log''' == |
| − | The | + | The "Support Log" provides the supporter with information from the internal processes of the ServiceCenter: |
:* Registration | :* Registration | ||
:* Connection setup, release and exceptions | :* Connection setup, release and exceptions | ||
| Line 40: | Line 40: | ||
| − | The | + | The "Support Log" provides filters for: |
:* Time based selection: From – Until, From – Duration | :* Time based selection: From – Until, From – Duration | ||
:* Text filter | :* Text filter | ||
| Line 48: | Line 48: | ||
| − | The | + | The "Support Log" has a limited history. The history may last from a few hours up to some days. The length of the history may be different from VoIP switch to VoIP switch and depends on the length of log files and amount of logging events. |
{{Note| | {{Note| | ||
| − | The | + | The "Support Log" is tenant sensitive. This means a supporter of tenant A is not able to see events of tenant B! |
| + | }} | ||
| Line 58: | Line 59: | ||
{{ToTop}} <!---------------------------------------------------------------------------------------> | {{ToTop}} <!---------------------------------------------------------------------------------------> | ||
| − | === Navigate to the | + | === Navigate to the "Support Log" === |
ConfigCenter: | ConfigCenter: | ||
| Line 68: | Line 69: | ||
{{ToTop}} <!---------------------------------------------------------------------------------------> | {{ToTop}} <!---------------------------------------------------------------------------------------> | ||
| − | === Get a | + | === Get a "Support Log" === |
Dialog: "Support Log": | Dialog: "Support Log": | ||
| Line 83: | Line 84: | ||
:# Insert the in "From" the desired start date/time | :# Insert the in "From" the desired start date/time | ||
:# Insert in "Duration" the needed length | :# Insert in "Duration" the needed length | ||
| − | :# Press on the keyboard the | + | :# Press on the PC keyboard the 'Enter' key : The "Until" date/time will be computed |
:# Click the {{Dialog_Button | Download}} | :# Click the {{Dialog_Button | Download}} | ||
| Line 90: | Line 91: | ||
:# Insert the in "From" the desired start date/time | :# Insert the in "From" the desired start date/time | ||
:# Insert the in "Until" the desired stop date/time | :# Insert the in "Until" the desired stop date/time | ||
| − | :# Press on the keyboard the | + | :# Press on the PC keyboard the 'Enter' key: The "Duration" will be computed |
:# Click the {{Dialog_Button | Download}} | :# Click the {{Dialog_Button | Download}} | ||
| Line 112: | Line 113: | ||
{{ToTop}} <!---------------------------------------------------------------------------------------> | {{ToTop}} <!---------------------------------------------------------------------------------------> | ||
| − | === Interpretation of a | + | === Interpretation of a "Support Log" === |
| − | The interpretation of a "Support Log" is quite easy and straight forward. With a little experience one will be | + | The interpretation of a "Support Log" is quite easy and straight forward. With a little experience one will be soon familiar with the interpretation. |
Interpretation and example of a call setup and release: | Interpretation and example of a call setup and release: | ||
| Line 124: | Line 125: | ||
{{ToTop | SupportToolConfigCenterTrace }} <!-------------------------------------------------------> | {{ToTop | SupportToolConfigCenterTrace }} <!-------------------------------------------------------> | ||
| − | == ConfigCenter '''Trace''' | + | == ConfigCenter '''Trace''' == |
| − | The | + | The "Trace" provides the supporter with information from the message traffic between the VoIP switch and external VoIP devices, such as PSTN gateway, SIP CPE, SIP or MGCP telephones. |
| − | The | + | The "Trace" contains: |
:* Session Initiation Protocol SIP registration and connection signaling messages | :* Session Initiation Protocol SIP registration and connection signaling messages | ||
:* Media Gateway Control Protocol MGCP audit and endpoint control messages | :* Media Gateway Control Protocol MGCP audit and endpoint control messages | ||
| Line 134: | Line 135: | ||
| − | The | + | The "Trace" provides filters for: |
:* Time based selection: From – Until, From – Duration | :* Time based selection: From – Until, From – Duration | ||
:* Text filter | :* Text filter | ||
| − | The | + | The "Trace" has a limited history. The history may last from a few hours up to some days. The length of the history may be different from VoIP switch to VoIP switch and depends on the length of log files and amount of logging events. |
| − | The interpretation of a | + | The interpretation of a "Trace" (PCAP formatted file) has to be done in an external application like [http://www.wireshark.org Wireshark network protocol analyzer]. Wireshark offers deep and rich [[{{NAMESPACE}}:support_voip_protocol | VoIP analysis ]]. |
{{Note| | {{Note| | ||
| − | The | + | The "Trace" is '''not''' tenant sensitive. This means a supporter of tenant A is able to see signaling messages of tenant B! |
| − | + | Due to this open display of information it may be possible that the "Trace" is not available for the supporters and operators on a multi tenant VoIP Switch. | |
| + | }} | ||
| Line 154: | Line 156: | ||
{{ToTop}} <!---------------------------------------------------------------------------------------> | {{ToTop}} <!---------------------------------------------------------------------------------------> | ||
| − | === Navigate to the | + | === Navigate to the "Trace" === |
ConfigCenter: | ConfigCenter: | ||
| Line 164: | Line 166: | ||
{{ToTop}} <!---------------------------------------------------------------------------------------> | {{ToTop}} <!---------------------------------------------------------------------------------------> | ||
| − | === Get a | + | === Get a "Trace" === |
Dialog: "Trace": | Dialog: "Trace": | ||
| Line 179: | Line 181: | ||
:# Insert the in "From" the desired start date/time | :# Insert the in "From" the desired start date/time | ||
:# Insert in "Duration" the needed length | :# Insert in "Duration" the needed length | ||
| − | :# Press on the keyboard the | + | :# Press on the PC keyboard the 'Enter' key: The "Until" date/time will be computed |
:# Click the {{Dialog_Button | Download}} | :# Click the {{Dialog_Button | Download}} | ||
| Line 186: | Line 188: | ||
:# Insert the in "From" the desired start date/time | :# Insert the in "From" the desired start date/time | ||
:# Insert the in "Until" the desired stop date/time | :# Insert the in "Until" the desired stop date/time | ||
| − | :# Press on the keyboard the | + | :# Press on the PC keyboard the 'Enter' key: The "Duration" will be computed |
:# Click the {{Dialog_Button | Download}} | :# Click the {{Dialog_Button | Download}} | ||
| Line 206: | Line 208: | ||
{{ToTop}} <!---------------------------------------------------------------------------------------> | {{ToTop}} <!---------------------------------------------------------------------------------------> | ||
| − | === Interpretation of a | + | === Interpretation of a "Trace" === |
The interpretation of a "Trace" needs experience! | The interpretation of a "Trace" needs experience! | ||
For more information: | For more information: | ||
| − | :* See [[{{NAMESPACE}}:support_voip_protocol#SupportSipKnowhow | SIP Knowhow ]] | + | :* See also [[{{NAMESPACE}}:support_voip_protocol#SupportSipKnowhow | SIP Knowhow ]] |
:* Get a [http://www.wireshark.org/#learnWS Wireshark training] | :* Get a [http://www.wireshark.org/#learnWS Wireshark training] | ||
| Line 221: | Line 223: | ||
Example of a Wireshark call list:<br> | Example of a Wireshark call list:<br> | ||
| + | |||
Navigate in Wireshark: | Navigate in Wireshark: | ||
{{Navigation_List | 1 | Menu "Statistics" }} | {{Navigation_List | 1 | Menu "Statistics" }} | ||
{{Navigation_List | 2 | Menu "VoIP Calls" }} | {{Navigation_List | 2 | Menu "VoIP Calls" }} | ||
| + | |||
| + | |||
| + | Wireshark dialog where all calls are listed of the actual trace: | ||
[[file:support_trace_voip_call_list.png |700px|left|frameless|link=| Example Trace VoIP Call List ]] | [[file:support_trace_voip_call_list.png |700px|left|frameless|link=| Example Trace VoIP Call List ]] | ||
<br clear=all> | <br clear=all> | ||
| Line 229: | Line 235: | ||
Example of a Wireshark call flow:<br> | Example of a Wireshark call flow:<br> | ||
| + | |||
| + | |||
Navigate in Wireshark: | Navigate in Wireshark: | ||
{{Navigation_List | 1 | Menu "Statistics" }} | {{Navigation_List | 1 | Menu "Statistics" }} | ||
{{Navigation_List | 2 | Menu "VoIP Calls" }} | {{Navigation_List | 2 | Menu "VoIP Calls" }} | ||
{{Navigation_List | 3 | Select the call of interest }} | {{Navigation_List | 3 | Select the call of interest }} | ||
| − | {{Navigation_List | 4 | Click | + | {{Navigation_List | 4 | Click {{Dialog_Button | Graph }} }} |
| + | |||
| + | |||
| + | Wireshark dialog where the message flow is shown of the selected call: | ||
[[file:support_trace_voip_call_flow.png |575px|left|frameless|link=| Example Trace VoIP Call Flow ]] | [[file:support_trace_voip_call_flow.png |575px|left|frameless|link=| Example Trace VoIP Call Flow ]] | ||
<br clear=all> | <br clear=all> | ||
| Line 241: | Line 252: | ||
{{ToTop | SupportToolConfigCenterCallData }} <!----------------------------------------------------> | {{ToTop | SupportToolConfigCenterCallData }} <!----------------------------------------------------> | ||
| − | == The ConfigCenter '''Call Data''' | + | == The ConfigCenter '''Call Data''' == |
The "Call Data" lists the CDR of all incoming or outgoing connections or connection attempts. Extended filters enable the supporter to search for specific calls. | The "Call Data" lists the CDR of all incoming or outgoing connections or connection attempts. Extended filters enable the supporter to search for specific calls. | ||
| Line 250: | Line 261: | ||
{{Note| | {{Note| | ||
| − | The "Call Data" is tenant sensitive. This means a supporter of tenant A is not able to see events of tenant B!}} | + | The "Call Data" is tenant sensitive. This means a supporter of tenant A is not able to see events of tenant B! |
| + | }} | ||
| Line 274: | Line 286: | ||
| − | + | ||
{{ToTop | SupportToolConfigCenterRegistration }} <!------------------------------------------------> | {{ToTop | SupportToolConfigCenterRegistration }} <!------------------------------------------------> | ||
| Line 296: | Line 308: | ||
The ConfigCenter "Channels" displays the state of connections. | The ConfigCenter "Channels" displays the state of connections. | ||
| + | |||
| + | |||
| + | |||
| + | |||
| + | |||
| + | |||
| + | |||
| + | {{ToTop}} <!---------------------------------------------------------------------------------------> | ||
| + | === Navigate to the "Channels" === | ||
| + | |||
| + | ConfigCenter: | ||
| + | {{Navigation_List | 1 | Menu "Channels" }} | ||
| + | |||
| + | |||
| + | |||
| + | |||
| + | |||
| + | {{ToTop}} <!---------------------------------------------------------------------------------------> | ||
| + | === Get the "Channels" === | ||
| + | |||
| + | Dialog: "System Utilization": | ||
| + | [[file:support_configcenter_channels_e.png |500px|left|frameless|link=| Dialog: "Channles" ]] | ||
| + | <br clear=all> | ||
| + | |||
| + | |||
| Line 301: | Line 338: | ||
{{ToTop | SupportToolConfigCenterUtilization }} <!-------------------------------------------------> | {{ToTop | SupportToolConfigCenterUtilization }} <!-------------------------------------------------> | ||
| − | == The ConfigCenter '''System Utilization''' | + | == The ConfigCenter '''System Utilization''' == |
The "System Utilization" gives a statistical overview of the VoIP Switch resource utilization. | The "System Utilization" gives a statistical overview of the VoIP Switch resource utilization. | ||
| + | |||
| + | |||
| + | {{Note| | ||
| + | On most VoIP Switches the "System Utilization" is not available for the supporters and operators. | ||
}} | }} | ||
| + | |||
| + | |||
| + | |||
| + | |||
| + | {{ToTop}} <!---------------------------------------------------------------------------------------> | ||
| + | === Navigate to the "System Utilization" === | ||
| + | |||
| + | ConfigCenter: | ||
| + | {{Navigation_List | 1 | Menu "System" }} | ||
| + | {{Navigation_List | 2 | Menu "Utilization" }} | ||
| + | |||
| + | |||
| + | |||
| + | |||
| + | {{ToTop}} <!---------------------------------------------------------------------------------------> | ||
| + | === Get the "System Utilization" === | ||
| + | |||
| + | Dialog: "System Utilization": | ||
| + | [[file:support_configcenter_system_utilization_e.png |500px|left|frameless|link=| Dialog: "System Utilization" ]] | ||
| + | <br clear=all> | ||
Revision as of 18:10, 30 August 2017
| Note | The features and/or parameters listed in this article may not be available from your telephone service provider. |
|
|
|
|
|
Introduction
The VoIP Switch Administrators, Operators, Supporters find here information about the Aarenet VoIP Switch "On Board" tools for analyzing and supporting general VoIP Switch issues and customer problems:
- The ConfigCenter "Support Log" displays the VoIP Switch internal activities
- The ConfigCenter "Traces" displays the signaling between the VoIP Switch an external devices
- The ConfigCenter "Call Data" lists the CDR of all incoming or outgoing connections or connection attempts. The "Call Data" provide shortcuts to SIP, SDP trace and RTP statistic information of a single call.
- The ConfigCenter "Address Registration" displays if a SIP device or MGCP MTA has registered a telephone number
- The ConfigCenter "System Components" displays the state and activity of the VoIP Switch components
- The ConfigCenter "Channels" displays the state of connections
- The ConfigCenter "System Utilization" displays a statistical overview of the VoIP Switch resource utilization
Contents
VoIP Switch ConfigCenter Support Tools
The ConfigCenter Support Log
The "Support Log" provides the supporter with information from the internal processes of the ServiceCenter:
- Registration
- Connection setup, release and exceptions
- Call Routing
- Used Ruleset
- Emergency calls
- etc
The "Support Log" provides filters for:
- Time based selection: From – Until, From – Duration
- Text filter
- Registration events
- Call events
- etc.
The "Support Log" has a limited history. The history may last from a few hours up to some days. The length of the history may be different from VoIP switch to VoIP switch and depends on the length of log files and amount of logging events.
| Note |
The "Support Log" is tenant sensitive. This means a supporter of tenant A is not able to see events of tenant B! |
ConfigCenter:
-
 Menu "Support"
-
 Menu "Support Log"
-
Get a "Support Log"
Dialog: "Support Log":
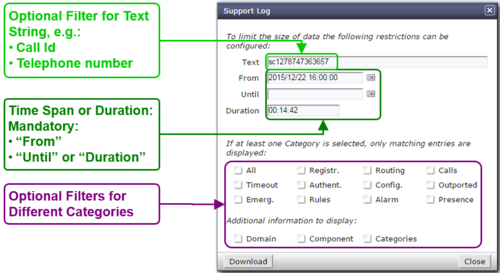
When the dialog "Support Log" opens it contains by default in "From" the actual date/time (-5min) and in "Duration" a duration of 5min:
- Click the Button [ Download ]
- Via HTTP an ASCII formatted file with the last 5 minutes will be downloaded
Retrieving a "Support Log" in the past:
- Insert the in "From" the desired start date/time
- Insert in "Duration" the needed length
- Press on the PC keyboard the 'Enter' key : The "Until" date/time will be computed
- Click the Button [ Download ]
or
- Insert the in "From" the desired start date/time
- Insert the in "Until" the desired stop date/time
- Press on the PC keyboard the 'Enter' key: The "Duration" will be computed
- Click the Button [ Download ]
| Best Practice |
Get the events of a connection in the past:
|
Interpretation of a "Support Log"
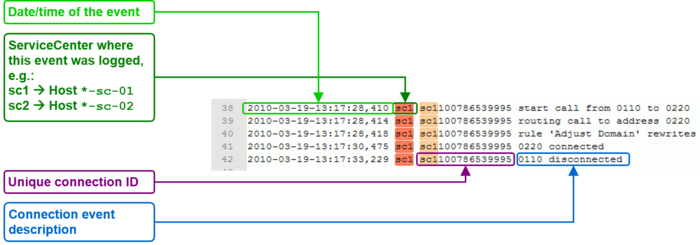
The interpretation of a "Support Log" is quite easy and straight forward. With a little experience one will be soon familiar with the interpretation.
Interpretation and example of a call setup and release:
ConfigCenter Trace
The "Trace" provides the supporter with information from the message traffic between the VoIP switch and external VoIP devices, such as PSTN gateway, SIP CPE, SIP or MGCP telephones.
The "Trace" contains:
- Session Initiation Protocol SIP registration and connection signaling messages
- Media Gateway Control Protocol MGCP audit and endpoint control messages
- Session Description Protocol SDP streaming media initialization parameters
The "Trace" provides filters for:
- Time based selection: From – Until, From – Duration
- Text filter
The "Trace" has a limited history. The history may last from a few hours up to some days. The length of the history may be different from VoIP switch to VoIP switch and depends on the length of log files and amount of logging events.
The interpretation of a "Trace" (PCAP formatted file) has to be done in an external application like Wireshark network protocol analyzer. Wireshark offers deep and rich VoIP analysis .
| Note |
The "Trace" is not tenant sensitive. This means a supporter of tenant A is able to see signaling messages of tenant B! Due to this open display of information it may be possible that the "Trace" is not available for the supporters and operators on a multi tenant VoIP Switch. |
ConfigCenter:
-
 Menu "Support"
-
 Menu "Trace"
-
Get a "Trace"
Dialog: "Trace":
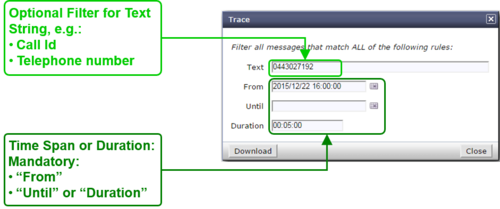
When the dialog "Trace" opens it contains by default in "From" the actual date/time (-5min) and in "Duration" a duration of 5min:
- Click the Button [ Download ]
- Via HTTP an PCAP formatted file with the last 5 minutes will be downloaded
Retrieving a "Trace" in the past:
- Insert the in "From" the desired start date/time
- Insert in "Duration" the needed length
- Press on the PC keyboard the 'Enter' key: The "Until" date/time will be computed
- Click the Button [ Download ]
or
- Insert the in "From" the desired start date/time
- Insert the in "Until" the desired stop date/time
- Press on the PC keyboard the 'Enter' key: The "Duration" will be computed
- Click the Button [ Download ]
| Best Practice |
Get the events of a connection in the past:
|
Interpretation of a "Trace"
The interpretation of a "Trace" needs experience!
For more information:
- See also SIP Knowhow
- Get a Wireshark training
Example of a Wireshark call capture, SIP setup and release:
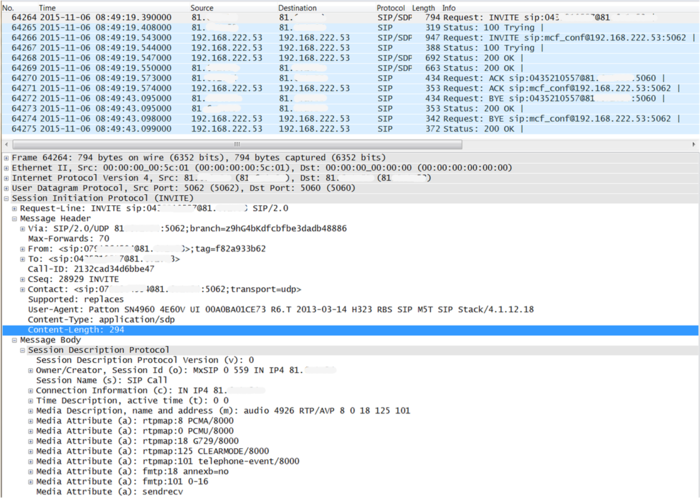
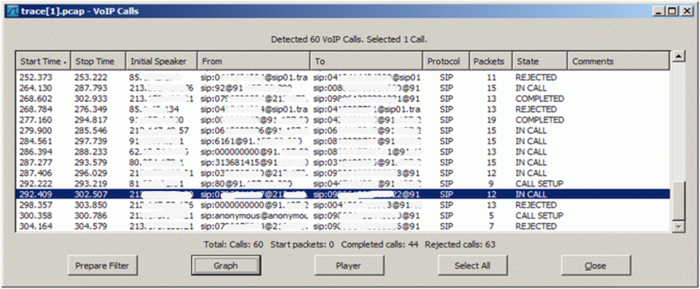
Example of a Wireshark call list:
Navigate in Wireshark:
-
 Menu "Statistics"
-
 Menu "VoIP Calls"
-
Wireshark dialog where all calls are listed of the actual trace:
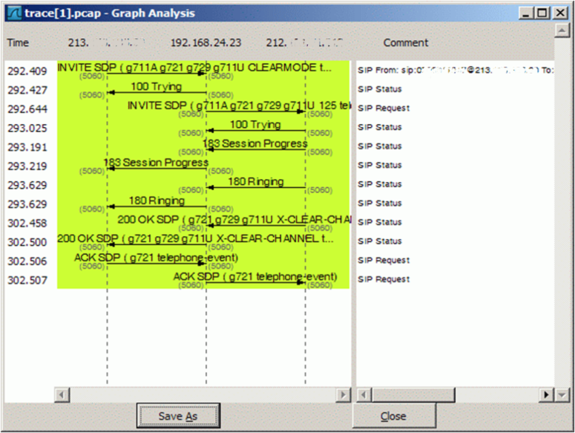
Example of a Wireshark call flow:
Navigate in Wireshark:
-
 Menu "Statistics"
-
 Menu "VoIP Calls"
-
-
 Select the call of interest
-
-
 Click Button [ Graph ]
-
Wireshark dialog where the message flow is shown of the selected call:
The ConfigCenter Call Data
The "Call Data" lists the CDR of all incoming or outgoing connections or connection attempts. Extended filters enable the supporter to search for specific calls.
The "Call Data" has a limited history. The length of the history may be different from VoIP switch to VoIP switch and depends on the CDR storage length in the date base.
| Note |
The "Call Data" is tenant sensitive. This means a supporter of tenant A is not able to see events of tenant B! |
ConfigCenter:
-
 Menu "Rating"
-
 Menu "Call Data"
-
Get a "Call Data"
Dialog: "Call Data":
The ConfigCenter Address Registration
The ConfigCenter "Address Registration" displays if a SIP device or MGCP MTA has registered the telephone number. The supporter finds information about IP address, SIP User Agent, registration time left.
The ConfigCenter System Components
The "System Components" displays the state and activity of the VoIP Switch components.
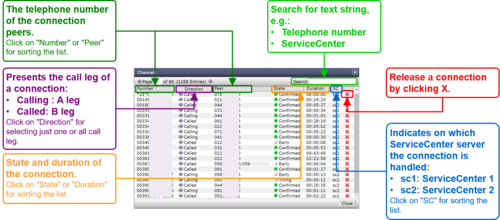
The ConfigCenter Channels
The ConfigCenter "Channels" displays the state of connections.
ConfigCenter:
-
 Menu "Channels"
Get the "Channels"
Dialog: "System Utilization":
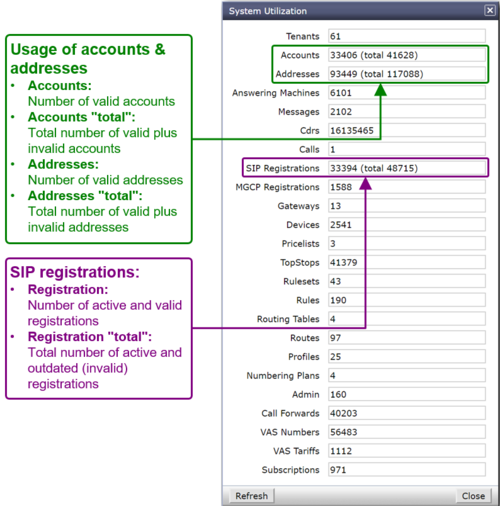
The ConfigCenter System Utilization
The "System Utilization" gives a statistical overview of the VoIP Switch resource utilization.
| Note |
On most VoIP Switches the "System Utilization" is not available for the supporters and operators. |
ConfigCenter:
-
 Menu "System"
-
 Menu "Utilization"
-
Get the "System Utilization"
Dialog: "System Utilization":
© Aarenet Inc 2018
Version: 3.0
Author: Aarenet
Date: May 2017